HP 3580A Audio Spectrum Analyser.
Update 7/4/16: I did a comparison using the GR 1568A wave analyser that I previously repaired and described, to locate and measure the components from the fast output of my Tek 106 square wave generator. The results from this analyser and the GR are in surprisingly close agreement, well surprisingly to me anyway. The GR is very tricky to use and I was pleased to get similar magnitude values.
HP gear is usually excellent and this unit is no exception. The other piece of HP kit that I value highly is the 339A distortion analyser that with its precision oscillator and voltmeter finds a great deal of use on my bench. Having just finished up an audio project (see Audio Audio below), I got inspired to get this working again. The last time I went to use it, the signal channel was non-responsive. As so often turns out to be the case, it was an oxidised board connector and once again, Deoxit came to the rescue! Oxidised connectors and switches are the norm in old test gear. I’m not going to go on at length, just show a few examples of it in use.
Here it is displaying the internal 10kHz test / calibration signal:
This signal can be used to calibrate the instrument within +/- 1.5% at 10kHz. It can also be used to check the frequency span which here although slightly off is within limits. The frequency range of the analyser is 5Hz to 50kHz. The spurious response is specified as more than 80dB below the input reference level and can be seen here more than 80dB down after all these years. Here, the signal fundamental at 10kHz is the first spike that can be seen to exactly meet the top of the graticule, then we have 20, 30, 40 and 50kHz harmonics.
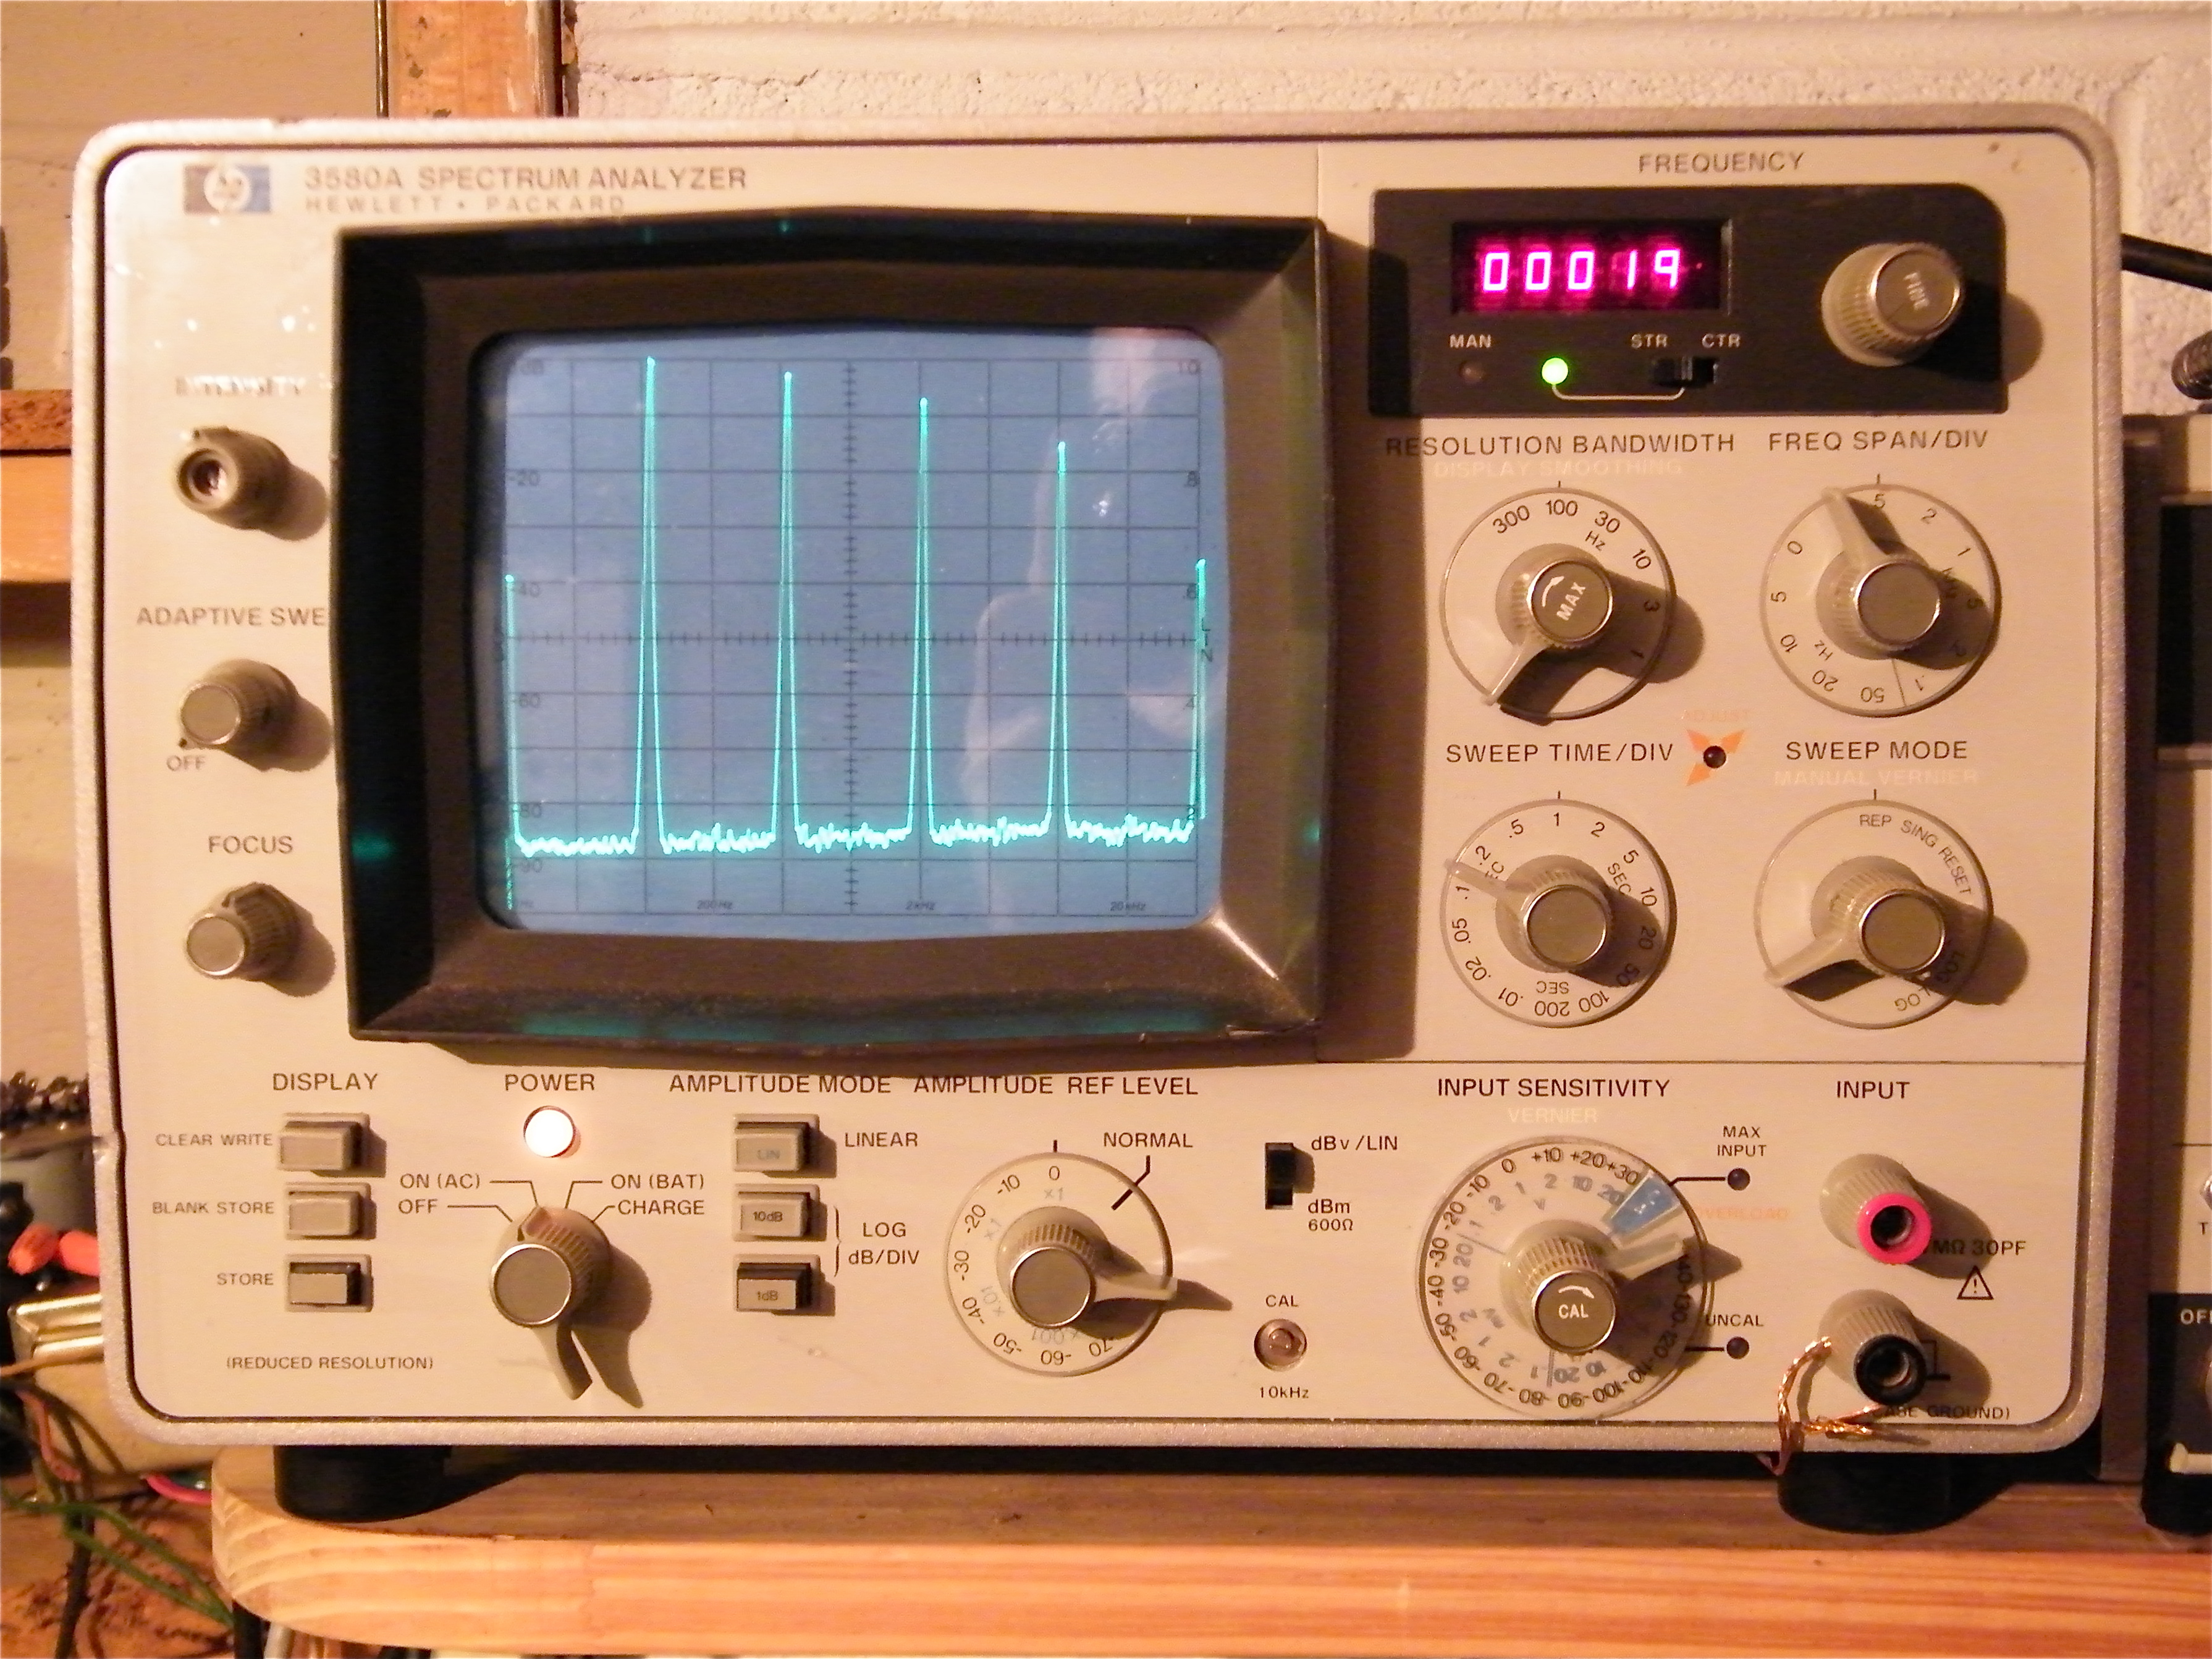
It has the capability of digitally storing one sweep that can be brought back up after a second sweep to allow direct comparison, here is an example of that feature, comparing the distortion spectrum produced by two different types of output tube, EL34s and 807s. The “dirtier” spectrum is from the 807s. The harmonics are at 1kHz intervals on a 1kHz fundamental (far left).

The sinusoidal tracking oscillator signal, swinging from 20Hz to 43kHz is available and may be used to do a frequency response sweep. The output can be varied from zero to to greater than 1 V rms into 600Ω. The sweep start is at 20Hz, so the graticule major divisions indicate 20, 43, 98, 200, 430, 980, 2k, 4.3k, 9.8k, 20k, 43k.
Here we have the same amp with at 10W (upper) and 1W (lower). The amplitude accuracy is given at +/- 0.5dB 100Hz to 20kHz and +/- 3% over the range 20Hz to 43kHz.
It shows about 2dB rise over the range, not bad for an old school amp with less than 6dB negative feedback.

I have only shown the basic features, there are many other modes of operation. One very neat feature is that the response can be cut off using the adaptive sweep control to above the noise level and this greatly increases that scan rate. This is because the filters will search for peaks in the noise and noise basically consists of a plethora of low level peaks that makes the filters work very hard. It is very useful when tweaking a circuit to watch the spectra change with the tweaking and the analyser is running in repetitive mode. Here is the test signal displayed with the baseline raised above the noise level:

Here is a capture of a frequency scan of an inverse RIAA network:

The shape is correct but the accuracy leaves something to be desired being compressed by about 4dB. The network measures better than 0.3dB except for two point that are closer to 1dB off. Since the rest of the points (I measured 11 points from 10Hz to 20kHz) are within 0.3dB, I suspect these two points are anomalous.
